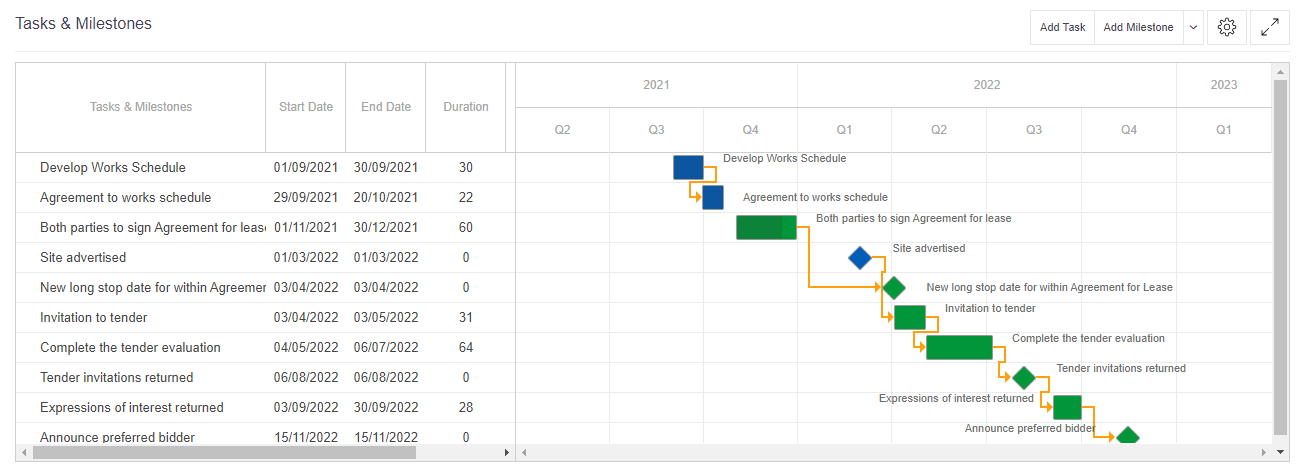
In Verto there are several ways in which a user can view their tasks and milestones against a project. The Gantt chart is one of those views.
Gantt charts are most commonly used for tracking project activities which consist of a list of activities mapped against a timescale. It is also useful to be able to show additional information about the project activities such as, how they relate to each other, how far each activity has progressed and what resources are being used for each task.